University Project | Deliverables: Data Visualization Poster (72x48 inches)
Overview
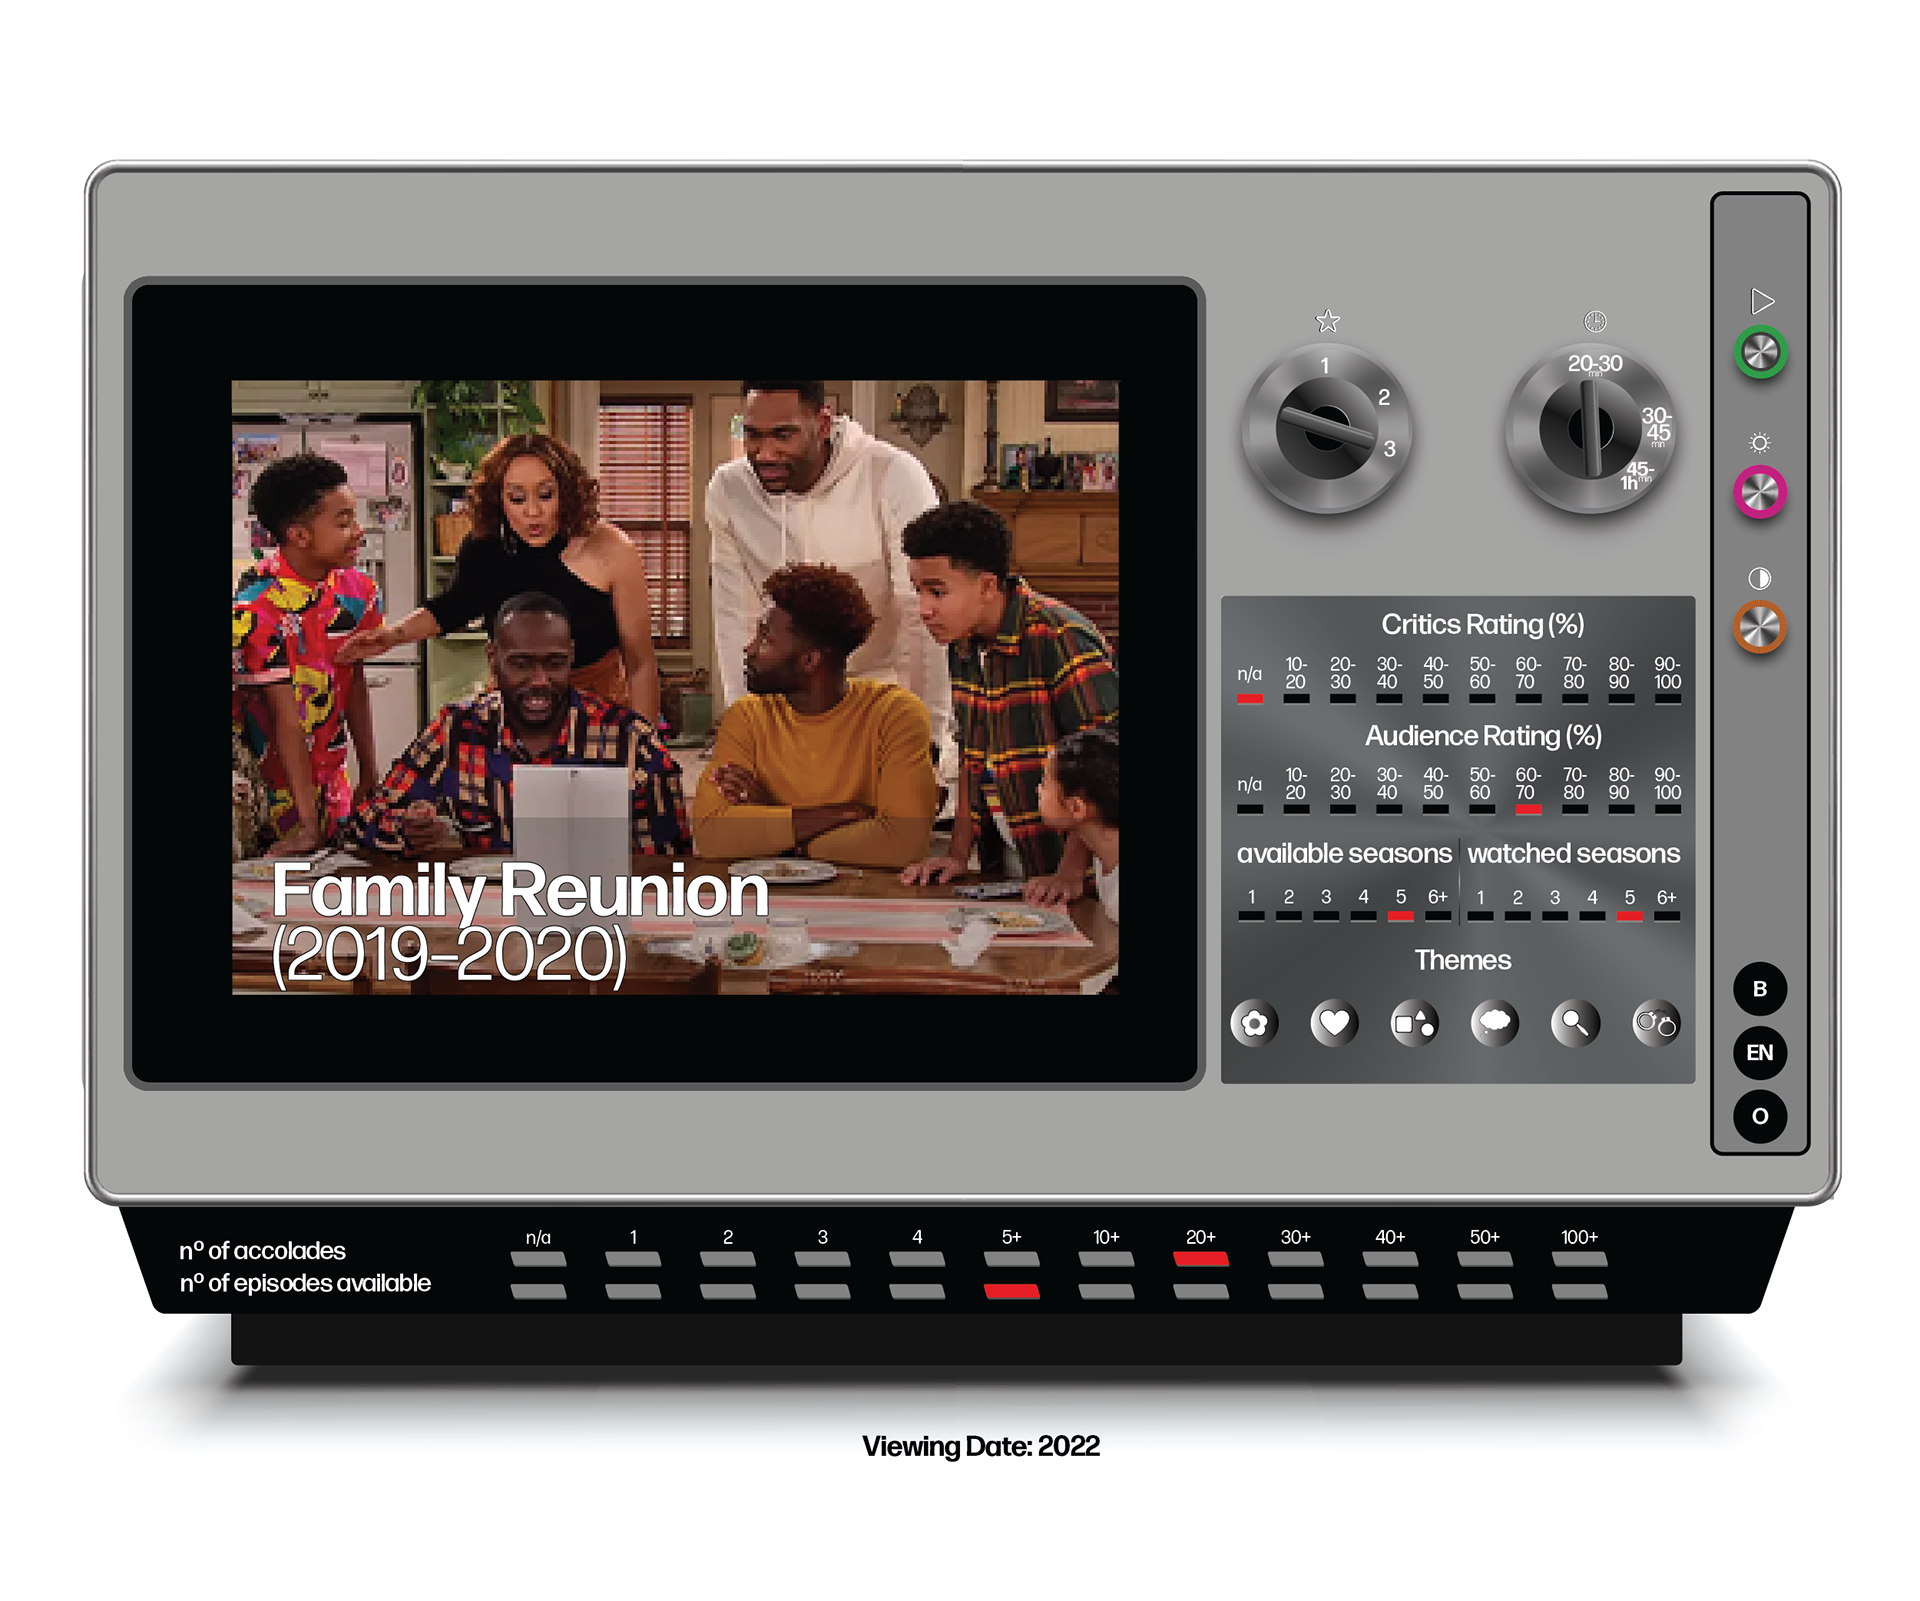
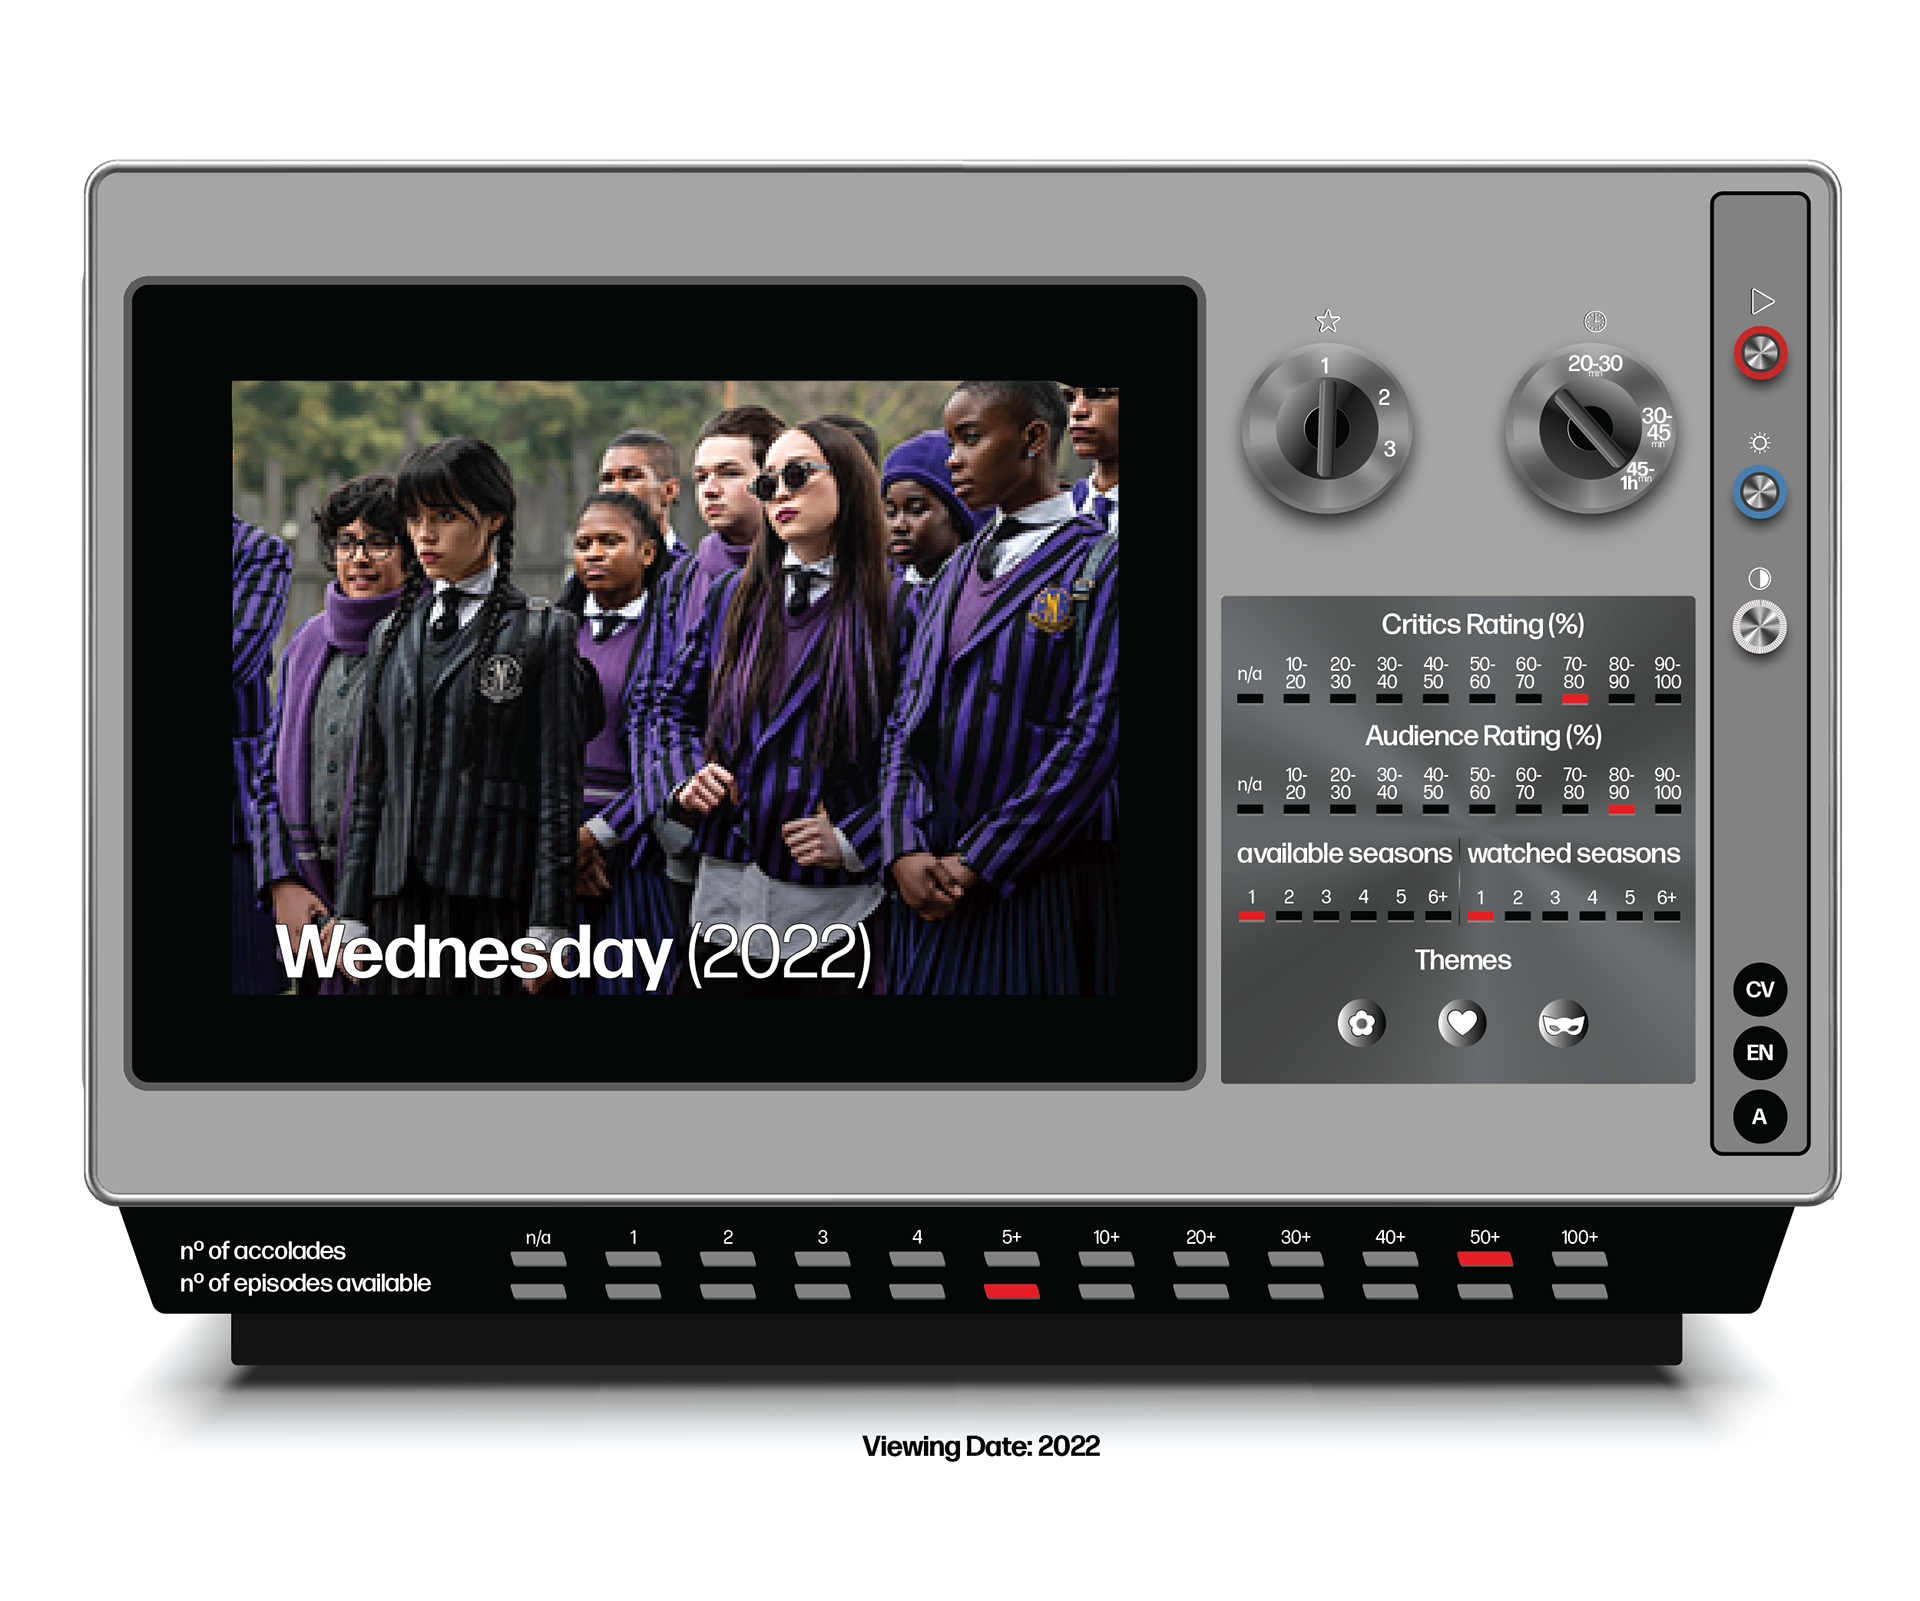
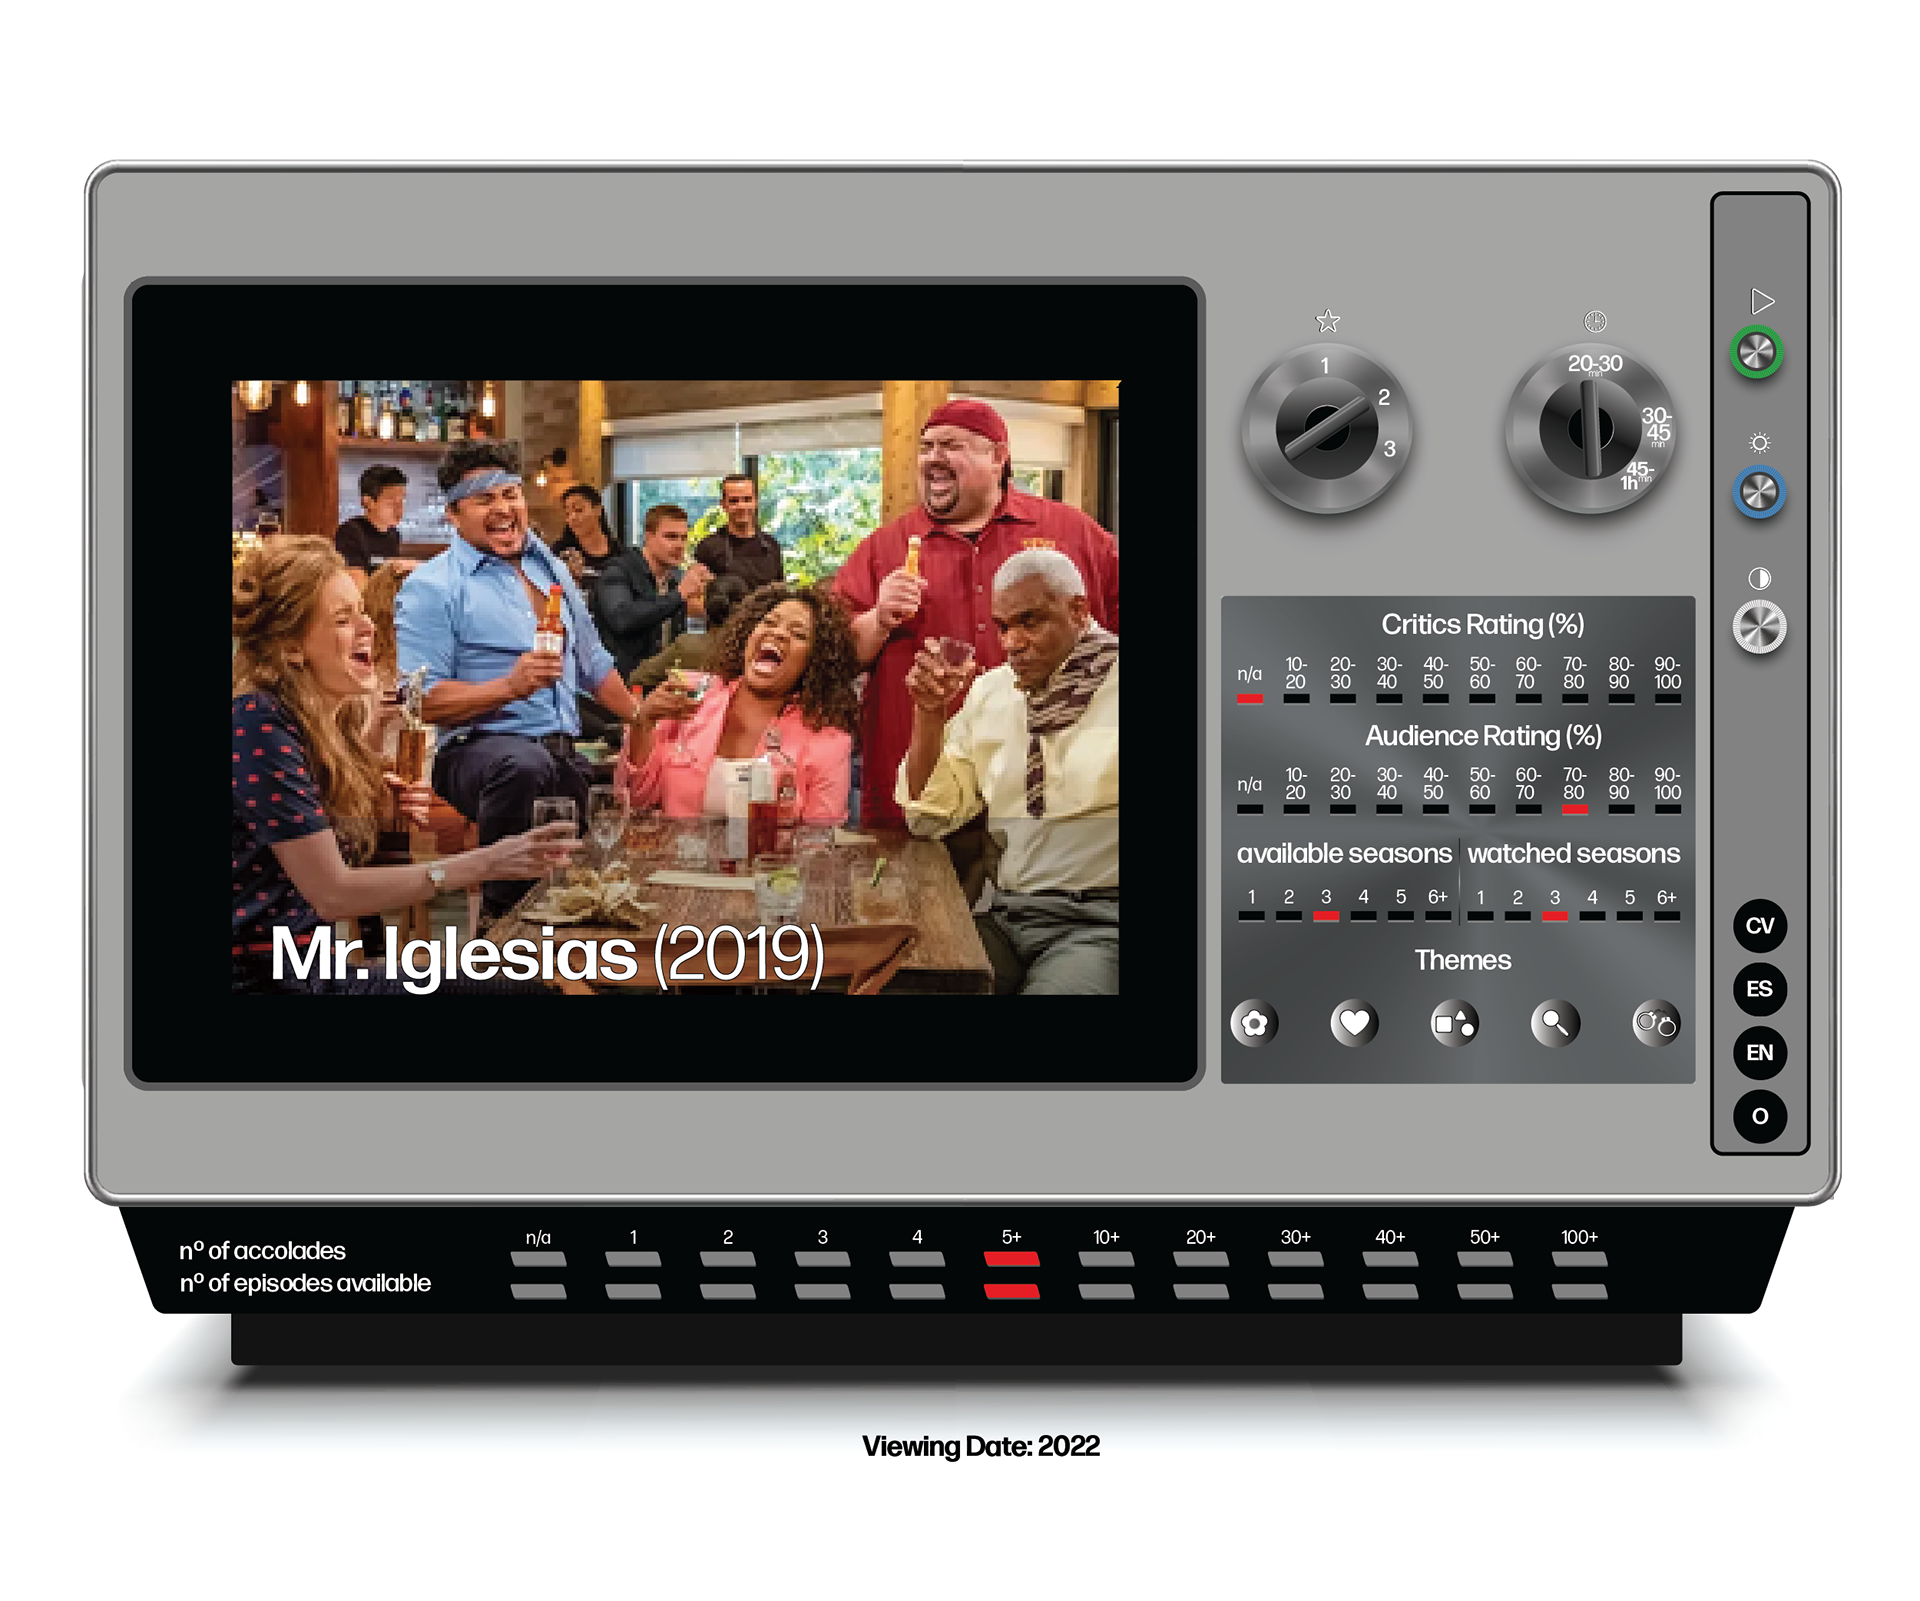
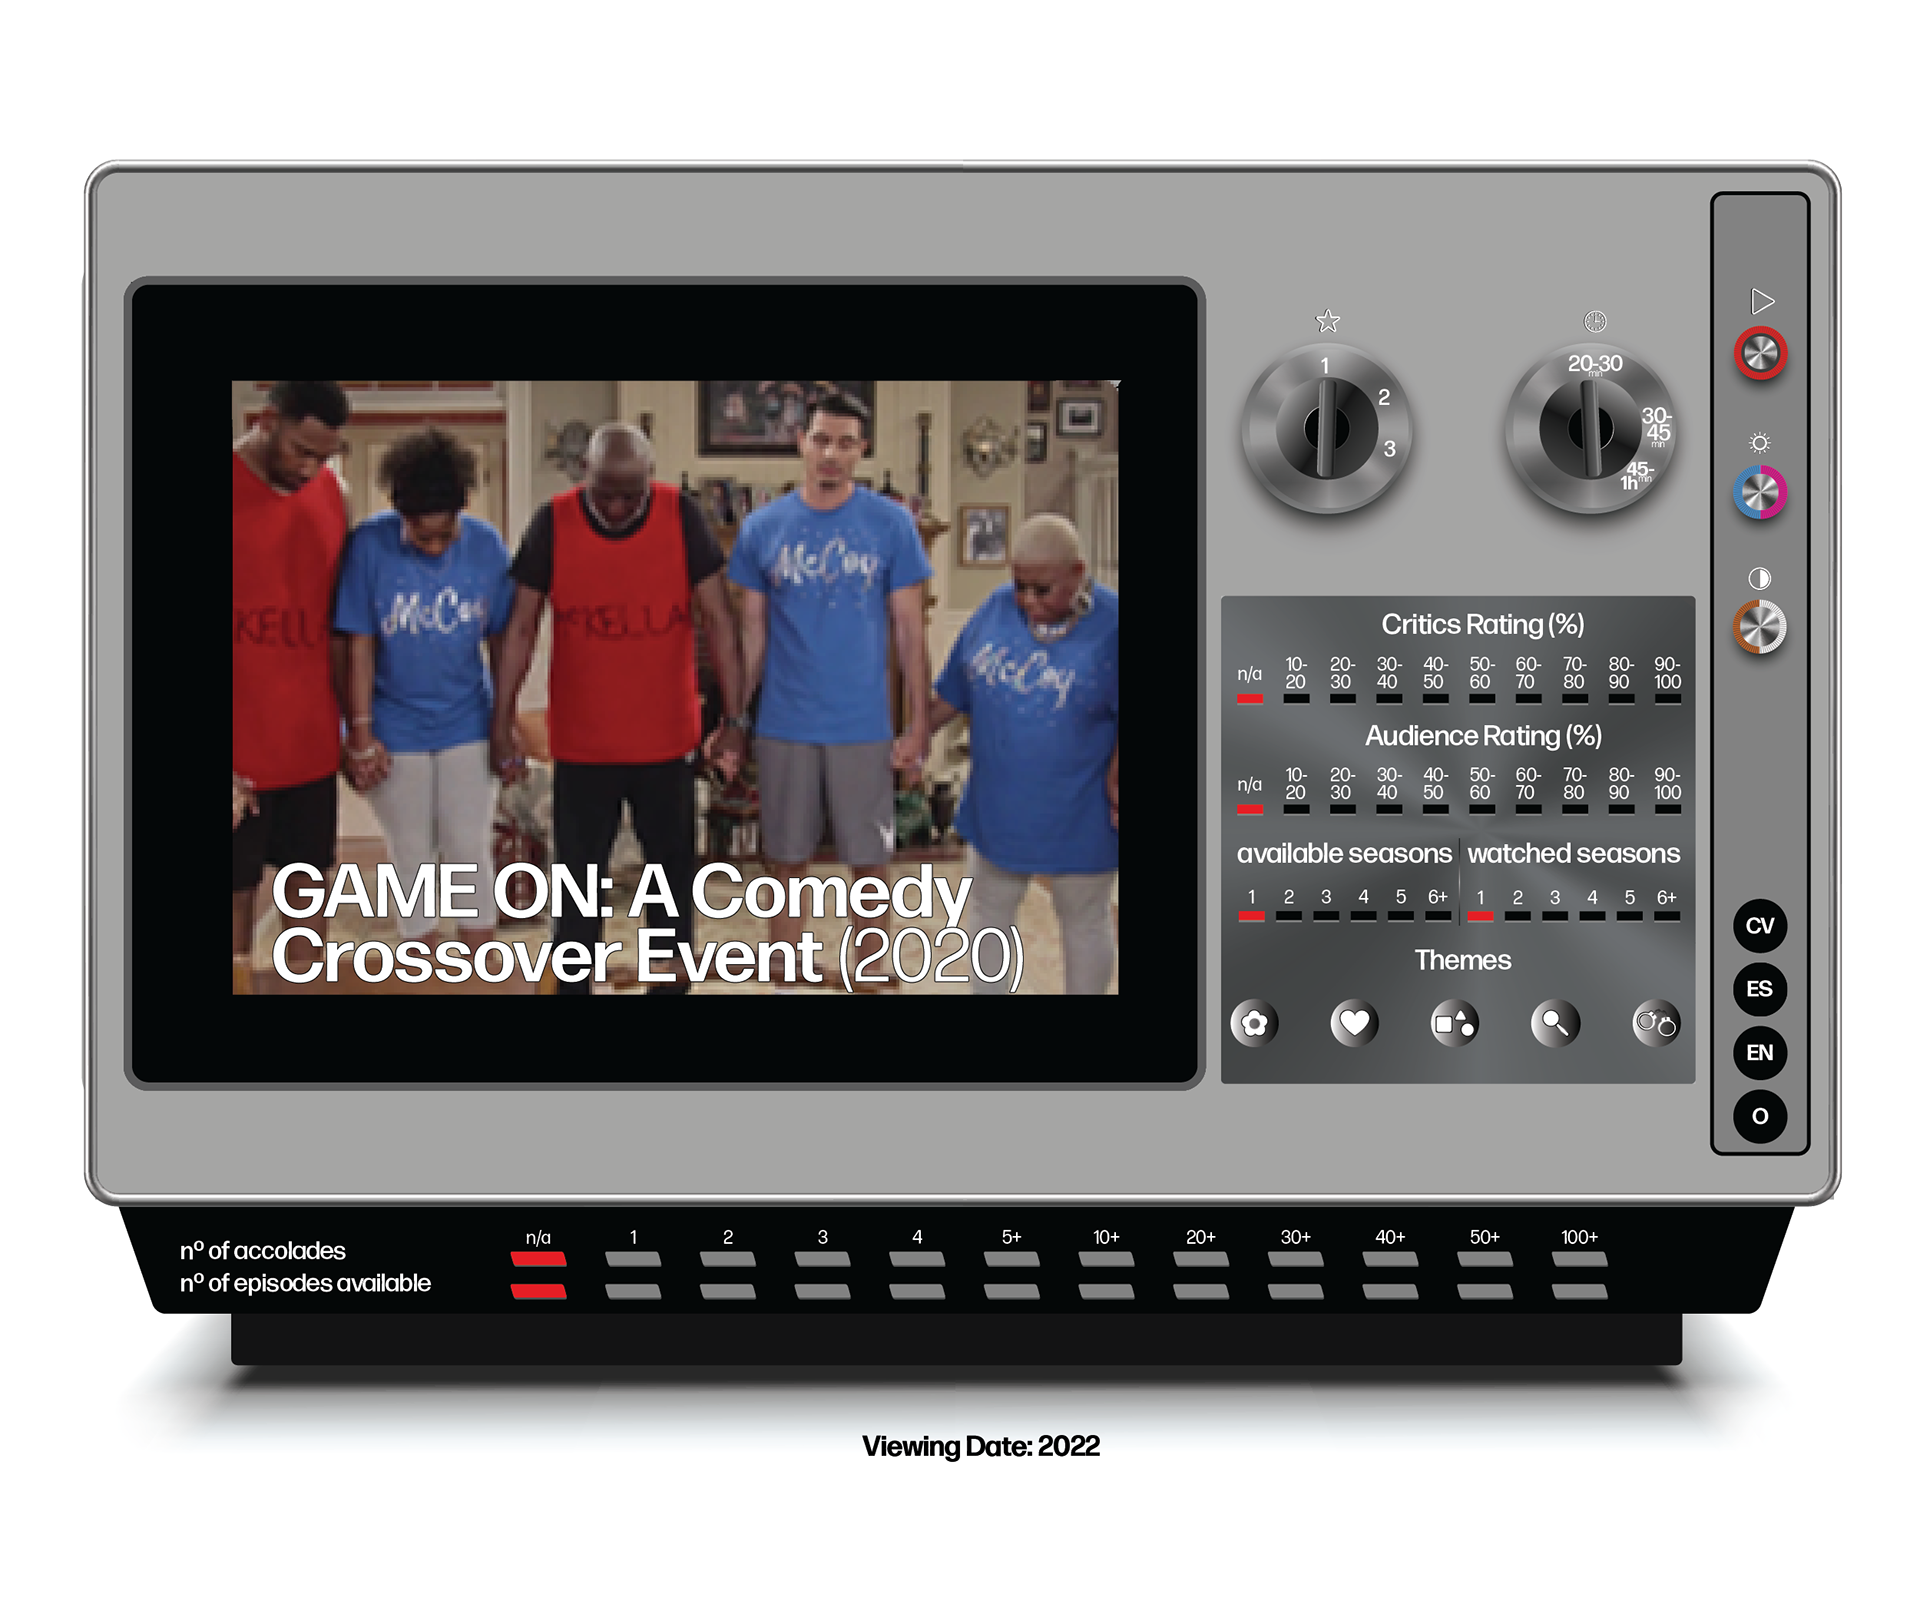
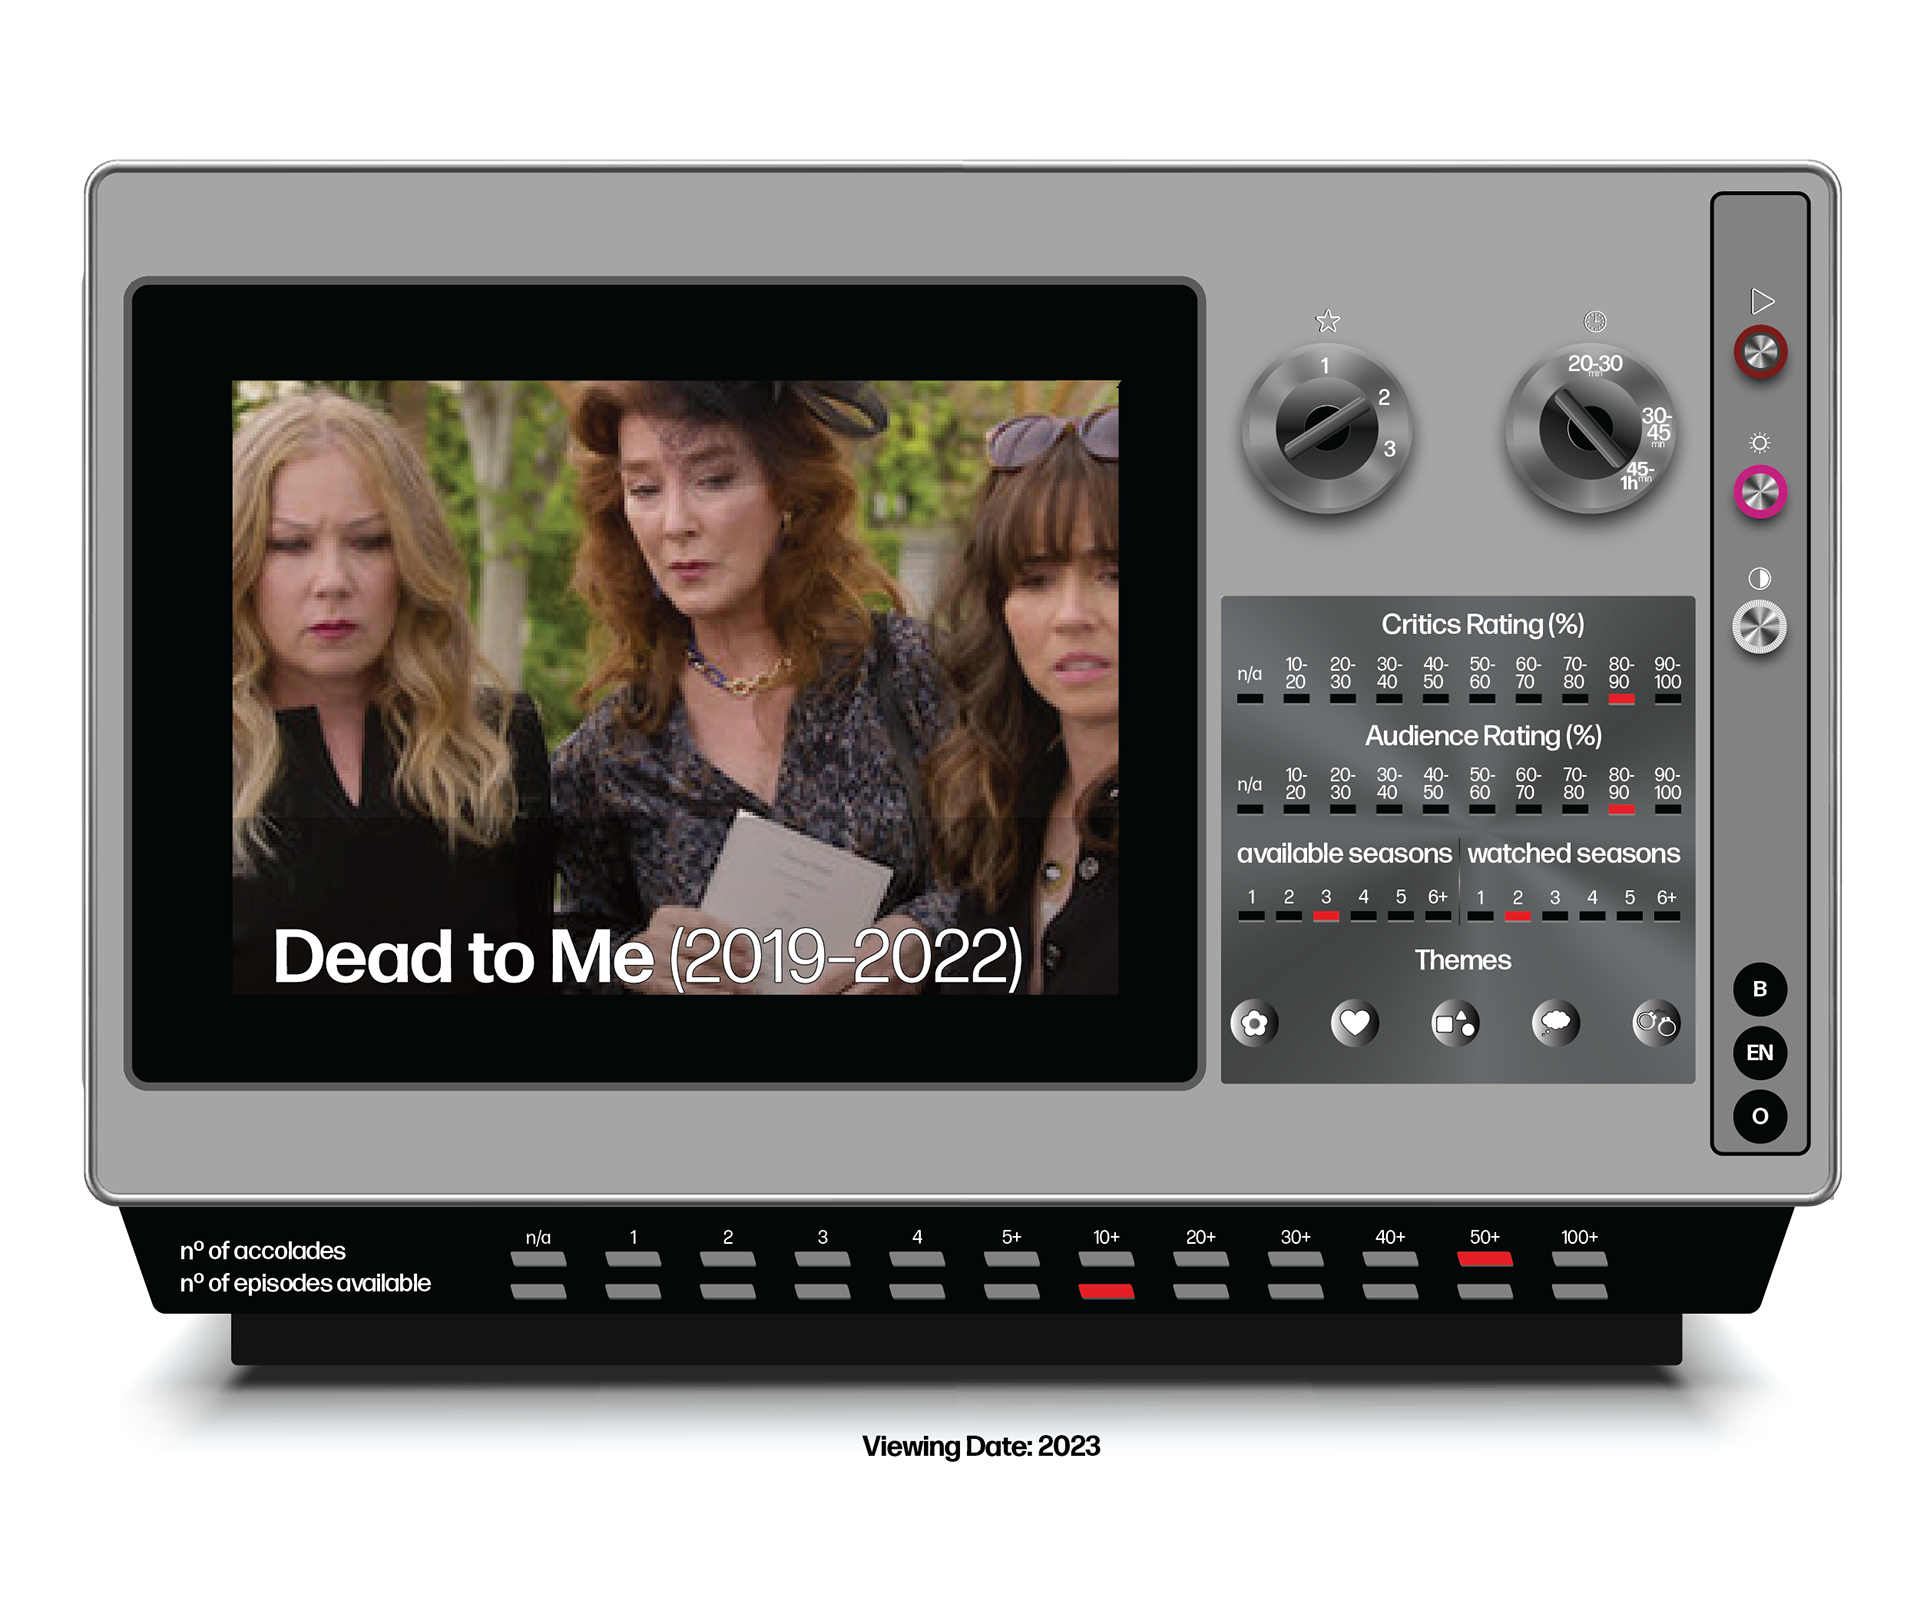
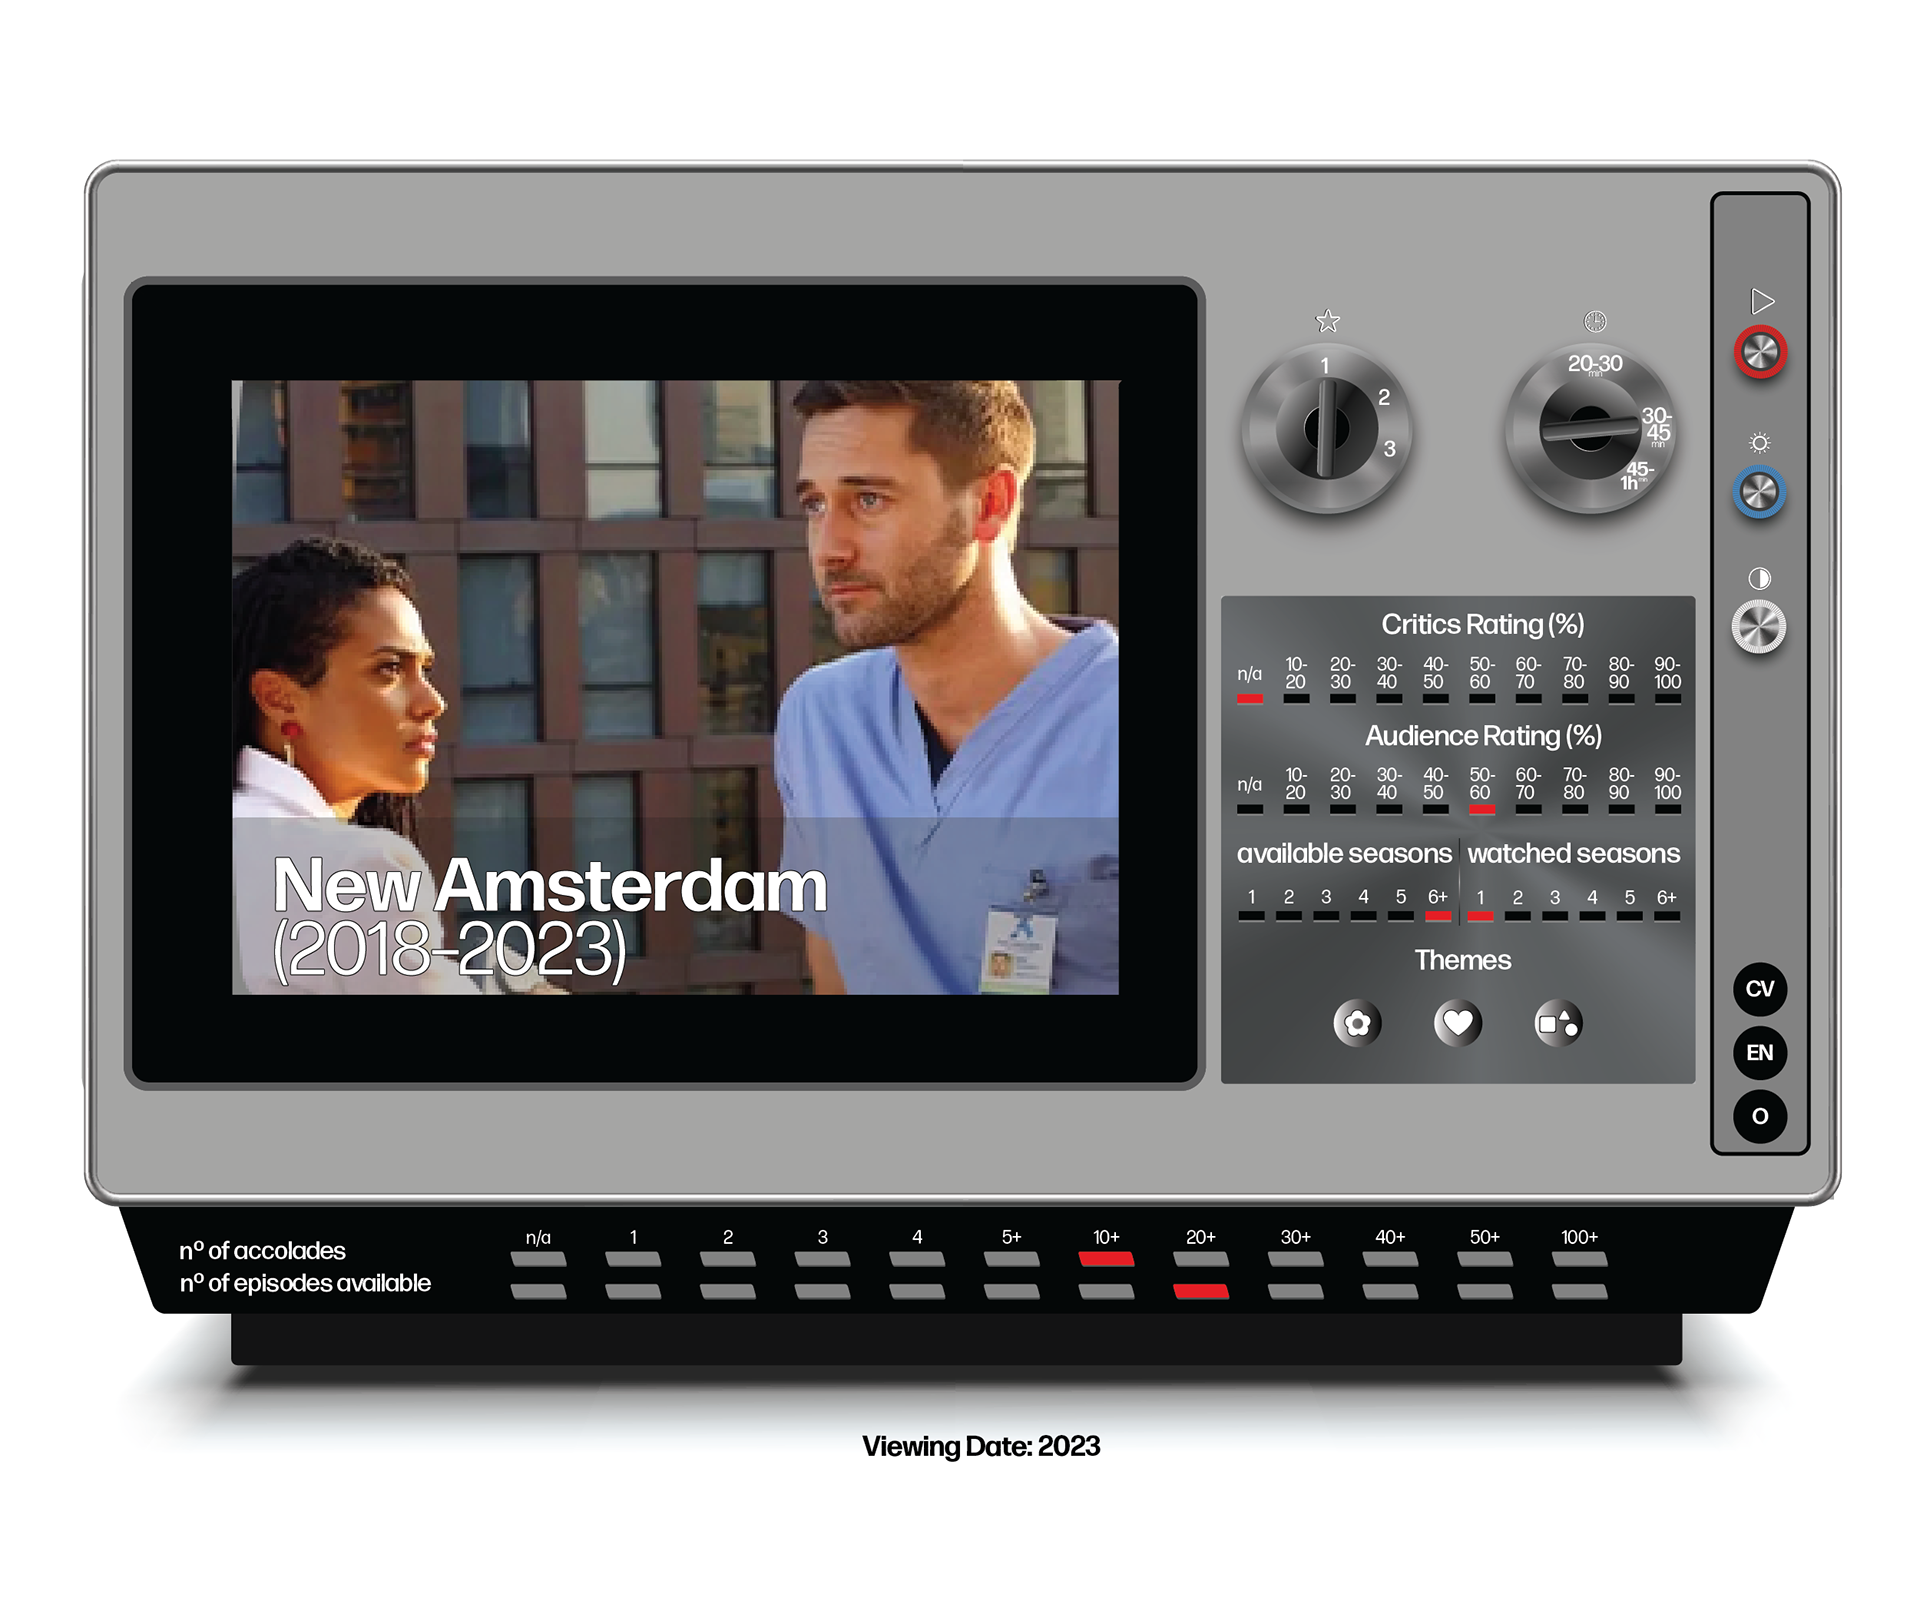
I designed a data visualization that distills complex information into clear insights. It shows my 17-month Netflix series history, condensing over 700 data points into a more accessible format.
Challenge
Craft an interesting narrative from 700+ data points of my personal Netflix series history into a comprehensible visual format, while making the visualization relevant and engaging for a broader audience than myself, was the primary challenge.
Solution
Designed a 72x48 inches poster with TV-shaped frames, condensing complex information and captivating viewers' attention.
Broadened poster’s appeal by refining the copy.
Used various datasets to encourage viewer introspection, totaling over 12 (see legend).
Encouraged interaction with large poster for comprehensive viewing.
Legend
A few closeups:

